Targeting winning stocks in 2019 - a look back
January 7, 2020
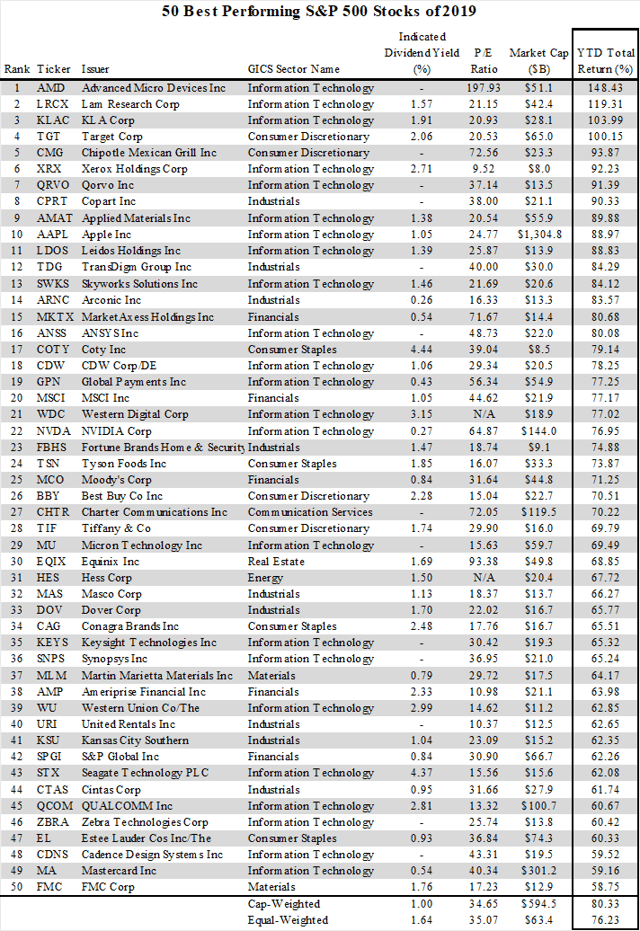
The 2019 year is over and the inevitable look back articles are all coming out. One of those articles inspired me to do a closer look at our portfolios in 2019. The article here (Seeking alpha article) summarizes the top 50 winners in the S&P 500 from 2019.
I was curious how many of these stocks we invested in our strategies in 2019 and did we achieve an over-representation within this out-performing group.
Our Concentrated US Equity Long Short portfolio is all S&P 500 stocks. And those S&P 500 picks represent around 35% of the portfolio in our Equity Long Short strategy with the remainder being Mid and Small cap stocks. For comparison to be apples to apples, we'll focus on this S&P 500 only equities among the stocks we bought in our portfolios.
Of the top 50 stocks in 2019, our portfolios owned 17 of them in 2019. Given that we invested in 120 S&P 500 stocks in 2019, this means we achieved an over-representation from these stocks. If random selection implies 10% success at picking these 50 stocks from the S&P 500, then picking more than 12 from our 120 means we achieved improved representation from this population.
The 17 stocks we owned from these 50 winners: AAPL, AMAT, AMD, CDNS, CMG, DOV, EL, FMC, GPN, KLAC, LCRX, MKTX, MLM, MU, QRVO, SNPS, and SWKS. This is a fair amount of technology sector representation but look at the list I borrowed from the Seeking Alpha article and you will see the winners came disproportionately from Information Technology.
Drilling down a little bit more, we find that we did not win on every one of these 17 stocks as 4 of those stocks were losers in our portfolio. However, our gains were exactly in line with the average gains of these stocks in 2019 on a time basis.
Across all 17 stocks, our average returns was 12.05% with an average hold time of 70 days. When you annualize these compound returns, that works out to just over +80% annualized returns. Looking at the Equal Weighted annual returns for these stocks, Seeking Alpha is reporting is was 76.23%. So our +80% is right in line.
Given that our digital database does not cover about 10% of the S&P 500 stock population, we'd expect to identify even fewer of these top 50 stocks. But we managed to capture more than expected and we delivered commensurate returns from them.
We are content with those results. Next week, we'll post a similar analysis around the mid and small cap universe.
Thanks again
Wayne Ferbert and the Alpha DNA Team
1112099-15781019865672612.png