Revisions Algorithm is driving results thru Analyst Calls!
February 21, 2020
If you subscribe to our monthly updates or just keep up with our progress, you know that our REVISIONS algorithm has been our best producing algorithm since its launch in 2017! We call it "Revisions" because the Machine Learning algorithm has been programmed to predict Wall Street Analyst Revisions across our stock universe. It prioritizes the identfication of stocks likely to receive an analyst upgrade to EPS or Revenue expectation based on the underlying digital trends and trajectory.
In other words, the algorithm is attempting to find companies producing revenue and/or EPS traction that Wall Street hasn't identified yet - but it is LIKELY to identify soon and therefore produce a Wall Street analyst revision (ie, upgrade). This is a close 'cousin' to the Earning Surprise approach. After all, if we are still invested in a stock going in to its earnings event, we must still believe their is still a gap between the consensus analyst expectation and the likely Revenue and EPS outcome.
So, earnings surprises are still one good measure of our stock prediction capabilities. However, the best tracking metric is the one we are presenting below: analyst upgrades across portfolio and by Alpha DNA score attractiveness.
We track the analyst upgrade metrics on an individual stock and individual broker analyst level. We aggregate those upgrades and downgrades by whether the analyst moved his Revenue target up (ie, upgrade) or moved his target down (ie, downgrade). We also track it for EPS and we track the magnitude of the change in the analyst target for EPS and Revenue.
We tend to obsess more about Revenue than EPS but we track both. Revenue is the lifeblood of any company as you can't produce earnings without it. Also, Revenue progress is most closely tied to digital traction. Our algorithms put more weight against Revenue as it selects stocks for our portfolio.
Let's look at how we did across these metrics. Revenue is up first. The data in all of these charts below is for all stocks in our universe that we scored since September 30, 2019. Remember that September 30th is when we moved ALL of our strategies to exclusively utilize the REVISIONS algorithm so it is a great date for this report. We have stratified the stocks into 20% tranches from the stocks we ranked the highest to the lowest. The data represents the percentage of Analyst changes to Revenue predictions for the NEXT quarter that were HIGHER than the analysts previous model update. The data below represents over 90,000 analyst changes to their models since September 30, 2019 and up until February 14, 2020.
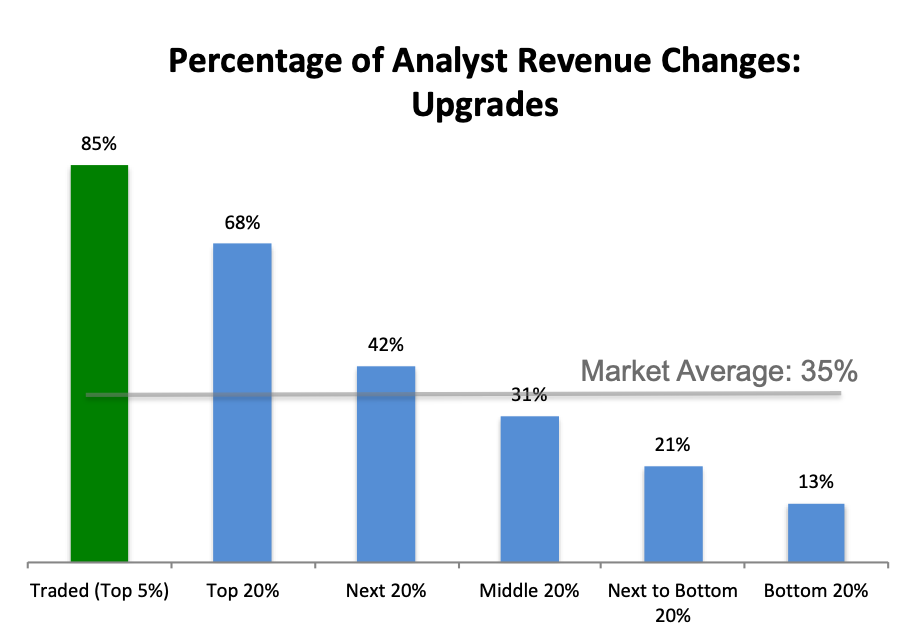
The green bar is the stocks we actually traded in our portfolios. So, the green bar is the analyst upgrade results that occurred AFTER we bought the stock and while we still held it. Not too shabby.
Some of you might be surprised at how low the MARKET average for Analyst upgrades is in this category. After all, it is well below 50%! But note that typically as you get closer to the earnings date, the analyst predictions tend to get lower. Why? Analysts tend to start out more optimistic and then as they get more clarity as you approach the earnings event, the analyst tends to bring the expectations down and rein in the optimism in exchange for 'realism'. The analyst 'optimism' is consistent with the fact that most Wall Street analysts carry many more Buy signals on stocks than Sell signals.
How did we do on EPS? We did quite well also as you can see below:
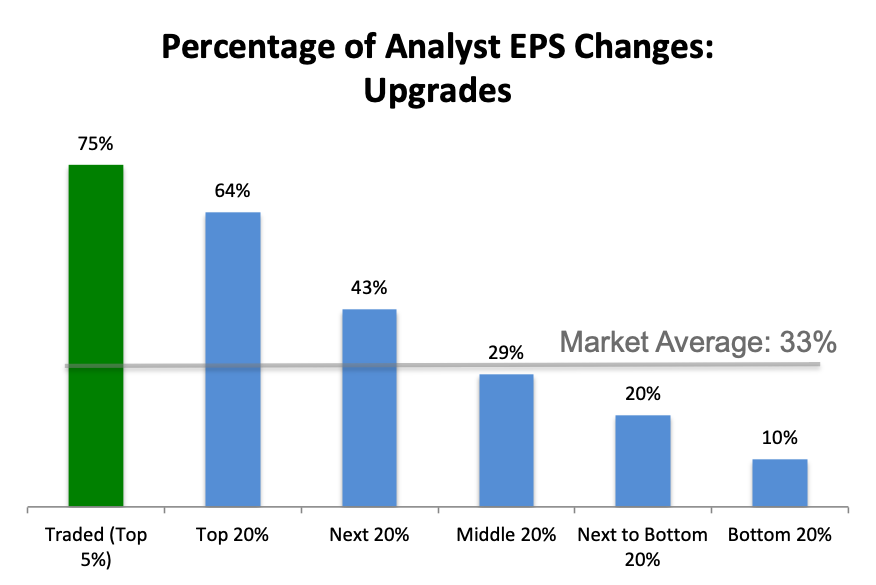
Again, our separation is signaificant in the stocks we traded. And again note how low the market average is for analyst upgrades for the upcoming quarterly EPS. Our separation in this metric is quite good.
Lastly, we ask the question: how many analyst updates resulted in BOTH a Revenue upgrade and an EPS upgrade from the analyst?
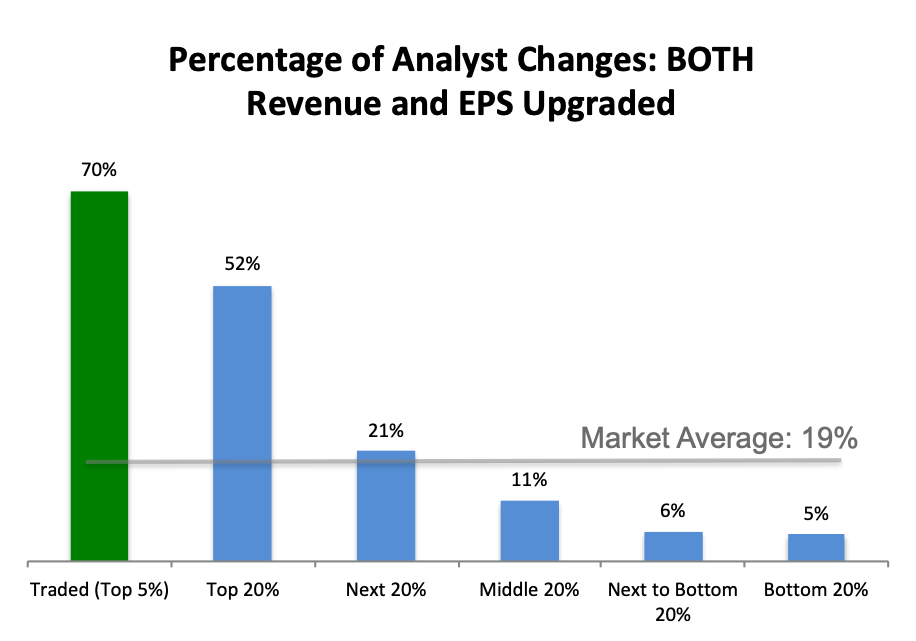
This result is actually the MOST signficant separation on this page among these charts. When a company is able to produce MORE Revenue AND this revenue is expected to produce MORE EPS, it means this company is likely propelling its results thru more demand for its products - which is producing the EPS gains. Companies tend to be rewarded the most for that outcome. If a company only improved on Revenue but did not improve its EPS, it is very likely the company is selling more products by discounting which likely means the company is struggling with demand. Or if a company only produces more EPS results but not more Revenue, it likely means the company produced the EPS thru more efficiency and/or cost cutting. That kind of improvement is typically seen as having some sort of limit on its continued imrpovement.
But companies that produce growth in Revenue and EPS are typically the darlings of Wall Street and analysts tend to climb over each other attempting to upgrade those kinds of companies when they see the underlying demand trends.
Summary
If you are a regular consumer of our earnings expectations reports, then you know that we have had a very strong streak of identifying EPS and Revenue surprises at earnings for the last 3+ years. We have been solidly in the 80%+ range for finding surprises in each of the Revenue and EPS category. Meanwhile, the average surprise is around 60% in those categories. The 20%+ points of separation in this metric is definitely strong and we are proud of it.
However, we obsess at Alpha DNA MUCH more on this Revisions metric. Mostly because it is the objective function we have built the Revisions algorithm to find. But also because the separation we are able to create within the portfolio population we purchase has been so remarkably higher than the market average. After all, the market average for Analyst upgrades is well below 50%! Meanwhile, our metrics all score in the 70% to 85% range. That kind of separation is difficult to call. And in the end, the ability to make that call successfully is the sustaining force behind our strategy.
If you want to learn more about these metrics and see more of the details in this analysis, call us at 443-288-6444 or email me at wayne.ferbert@alphadnaim.com