Peer Comparison: May 2021 Performance
June 8, 2021
Starting this month, we will post a monthly Returns comparison to our peers for our Separate Managed Accounts (SMA) strategies. Our peer competitors in this analysis are the 5 largest mutual funds by Assets Under Management that are Hedged Equity mutual funds. These 5 mutual funds are the largest and we want to be compared to the biggest players in this space. We believe we are changing the hedged equity landscape with a smarter approach that benefits from our systematic machine learning technologies.
We pull all of our data on these funds for our comparison from Morningstar. We also report all of our separate account returns to Morningstar. We encourage you to use Morningstar to compare our SMA returns to other SMA, mutual fund, and ETF strategies.
While May was a modest down month for our Hedged Equity strategies, our Year to Date performance is still top of the table when compared to our peers in the Hedged Equity category. We continue to out-perform the category leaders in Assets Under Management. We also compare very favorably to the S&P 500 which is a long only index with no hedge.
More importantly, we are happiest with our consistent leadership across all of the 1 year, 2 year, 3-year, and 4-year time frames since we launched our two Hedged Equity strategies. We hope you find this interesting and reach out to us to schedule some time to talk! Email me at wayne.ferbert@alphadnaim.com or call me at 443-288-6444
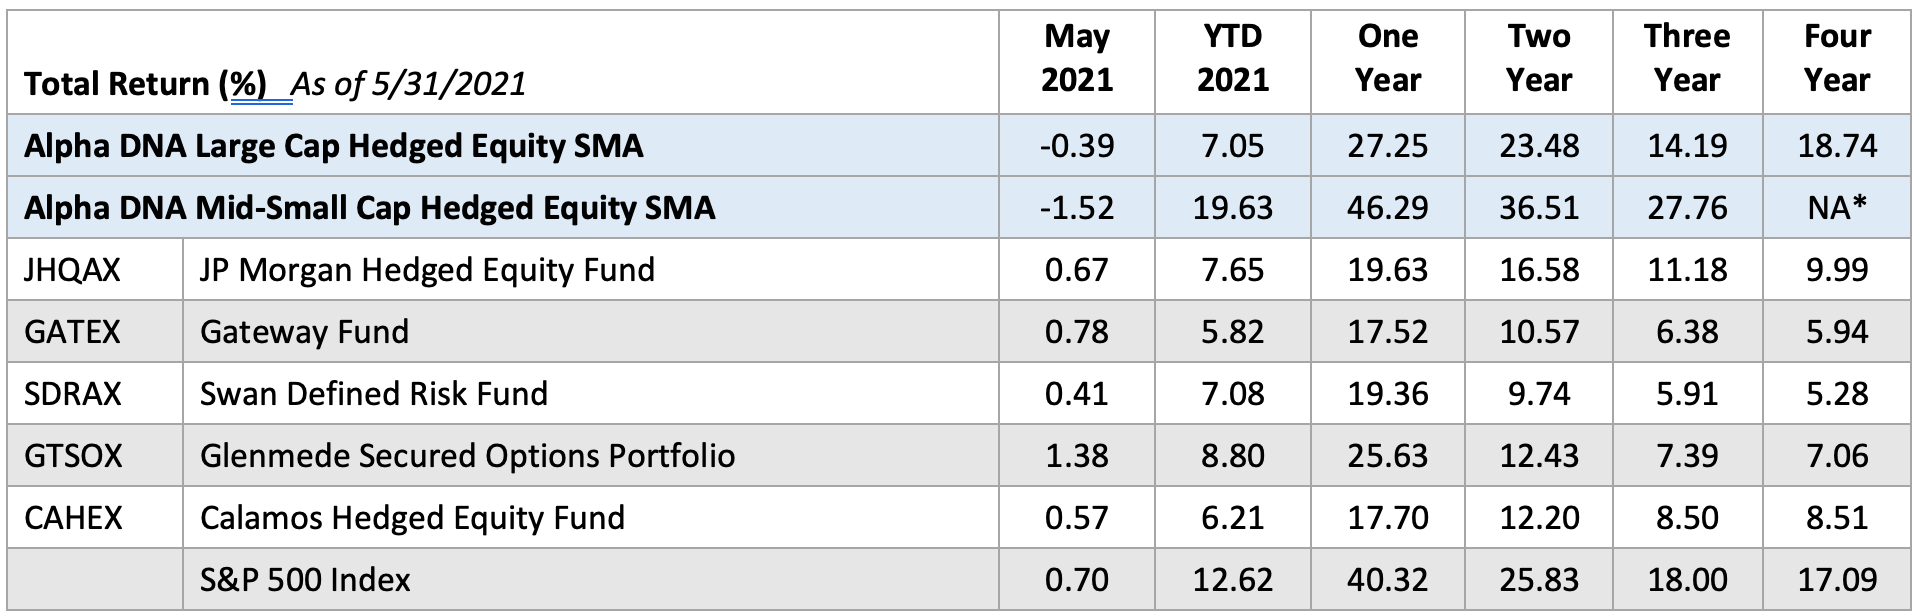
Source: Morningstar; * NA - the Mid/Small Cap strategy has an inception less than 4 years.
Performance data quoted represents past performance and is no guarantee of future results. Current performance may be lower or higher than the performance data quoted. Investment return and principal value will fluctuate so that an investor’s shares, when redeemed, may be worth more or less than original cost. Returns less than one year are not annualized. Returns more than one year are annualized.
Note: Returns are expressed in US Dollars net of fees.
Alpha DNA Investment Management is a registered investment adviser and investment manager that specializes in quant equity strategies. Alpha DNA is a separate accounts manager and all returns expressed herein are solely from the separate accounts business within Alpha DNA.
Alpha DNA claims compliance with the Global Investment Performance Standards (GIPS). GIPS® is a registered trademark of CFA Institute. CFA Institute does not endorse or promote this organization, nor does it warrant the accuracy or quality of the content contained herein. To receive a full list of composite descriptions of Alpha DNA and/or a presentation that complies with the GIPS standards, contact Wayne Ferbert at (443)-288-6444 or wayne.ferbert@alphadnaim.com
All investments involve the risk of potential investment losses as well as the potential for investment gains. Prior performance is no guarantee of future results and there can be no assurance, and clients should not assume, that future performance of any of the model portfolios will be comparable to past performance.
These results should not be viewed as indicative of the advisor’s skill. The prior performance figures indicated herein represent portfolio performance for only a short time period, and may not be indicative of the returns or volatility each portfolio will generate over a long time period. The performance presented should also be viewed in the context of the broad market and general economic conditions prevailing during the periods covered by the performance information. The actual results for the comparable periods would also have varied from the presented results based upon the timing of contributions and withdrawals from individual client accounts. The performance figures contained herein should be viewed in the context of the various risk/return profiles and asset allocation methodologies utilized by the asset allocation strategists in developing their model portfolios, and should be accompanied or preceded by the model.
Standard deviation is a measure of the dispersion of a set of data from its mean. The more spread apart the data, the higher the deviation. In finance, standard deviation is applied to the annual rate of return of an investment to measure the investment's volatility.
Before investing you should carefully consider the Fund’s investment objectives, risks, charges and expenses.
JHQAX - Objective: The Fund seeks to provide capital appreciation.
Strategy: The Fund seeks to provide capital appreciation through participation in the broad equity markets while hedging overall market exposure relative to traditional long-only equity strategies. The Fund uses an enhanced index strategy to invest in these equity securities, which primarily consist of common stocks of large cap US companies. The Fund will also systematically purchase and sell exchange traded put options and sell exchange traded call options, employing an option overlay known as a “Put/Spread Collar” strategy. The options may be based on the S&P 500 Index or on exchange-traded funds (ETFs)that replicate the S&P 500 Index (S&P 500 ETFs).
To implement the enhanced index strategy, the adviser employs a three-step process that combines research, valuation and stock selection. The adviser takes an in-depth look at company prospects, which is designed to provide insight into a company’s real growth potential. The research findings allow the adviser to rank the companies in each sector group according to their relative value. As a part of its investment process, the adviser seeks to assess the impact of environmental, social and governance factors (including accounting and tax policies, disclosure and investor communication, shareholder rights and remuneration policies) on the cash flows of many companies in which it may invest to identify issuers that the adviser believes will be negatively impacted by such factors relative to other issuers.
Under normal circumstances, the Fund invests at least 80% of its Assets in equity securities.
Maximum Sales Load – 5.25% Expense Ratio – 0.85%
GATEX - Objective: The Fund seeks to capture the majority of the returns associated with equity market investments, while exposing investors to less risk than other equity Investments.
Strategy: The Fund strives not only for the majority of the returns associated with equity market investments, but also for returns in excess of those available from other investments comparable in volatility. Because, as described above, the Fund writes index call options and purchases index put options in addition to investing in equity securities, the Fund’s historical volatility has been closer to intermediate- to long-term fixed-income investments (intermediate-term are those with approximately five-year maturities and long-term are those with maturities of ten or more years) and hybrid investments (blends of equity and short-term fixed-income securities) than to equity investments.
The Fund invests in a diversified stock portfolio, generally consisting of approximately 200 to 400 stocks, designed to support the Fund’s index option-based risk management strategy as efficiently as possible while seeking to enhance the Fund’s after-tax total return. Generally, the Adviser tries to minimize the difference between the performance of the stock portfolio and that of the index or indices underlying the Fund’s option strategies while also considering other factors, such as predicted dividend yield.
Under normal circumstances, the Fund invests in a broadly diversified portfolio of common stocks, while also selling index call options and purchasing index put options. The Fund may invest in companies with small, medium, or large market capitalizations.
Maximum Sales Load – 5.75% Expense Ratio – 1.02%
SDRAX - Objective: The Fund seeks long term capital appreciation.
Strategy: The Funds proprietary “Defined Risk Strategy” (DRS) seeks to provide risk-managed growth of capital by matching or exceeding the long-term performance of the stock market while seeking to minimize the traditional losses incurred during bear markets. The Fund invests primarily in equity securities of large capitalization (over $10 billion) US companies directly or through ETFs. The sub-adviser executes ETF trades through an exchange rather than trading directly with a fund.
The DRS philosophy is based upon the sub-adviser’s research indicating that market timing and/or stock selection is extremely difficult, may produce volatile returns and that asset allocation is limited in its risk reduction. Using DRS, the sub-adviser seeks to “define risk” by seeking to protect against large losses by hedging equity ETFs through investments in protective long-term S&P 500 Index put options. The put strategy is executed using exchange-traded S&P 500 Index put options to hedge the portfolio and to reduce volatility.
To generate additional returns, the sub-adviser buys and sells short-term (generally 1-3 month) (i) put and call options on equity indices, such as the S&P 500, Sector SDPR and Russell 2000, (ii) ETFs and (iii) futures on a regular basis. Additionally, the sub-adviser will regularly engage in various spread option strategies.
Maximum Sales Load – 5.50% Expense Ratio 1.54%
GTSOX – Objective: The Fund seeks Long-term capital appreciation and option premiums consistent with reasonable risk to principal.
Strategy: Under normal market circumstances, the Portfolio uses option writing strategies in an effort to obtain option premiums and reduce risk. The Portfolio will implement buy-write (covered call) and/or cash-secured put option strategies on stock index exchange traded funds (“ETFs”), stock indices and/or individual stocks held by the Portfolio. Under normal market circumstances, at least 80% of the value of the Portfolio’s total assets (including borrowings for investment purposes) will be subject to secured option strategies, which are written covered call and/or secured put options on stock index ETFs, stock indices and/or individual stocks held by the Portfolio.
The Portfolio is called “Secured Options” because the call and put options it writes will be covered by owning the security, index or ETFs underlying the option, holding an offsetting option, segregating cash or other liquid assets at not less than the full value of the option or the exercise price, and/or using other permitted coverage methods. At any given time, the Portfolio’s assets may be subject to only calls or only puts, or a combination of both strategies.
To the extent that the Portfolio’s assets are not only subject to cash-secured puts or calls on a stock index covered by stock index ETFs, the Portfolio also intends to invest in a diversified portfolio of equity securities with generally similar risk and return characteristics as the S&P 500® Index. The Portfolio may invest in companies with small, medium or large market capitalizations in advancement of its investment objective.
Expense Ratio – 0.68%
CAHEX – Objective: The Fund investment seeks total return with lower volatility than equity markets.
Strategy: Under normal circumstances, the Fund invests at least 80% of its net assets (plus any borrowings for investment purposes) in equity securities and securities with economic characteristics similar to stock or the equity markets. The Fund invests in a broadly diversified portfolio of equity securities while also writing (selling) index call and put options and/or entering into other options strategies on equity securities and/or broad-based indices. The Fund may write call options (i) on a portion of the equity securities in the Fund’s portfolio and (ii) on broad-based securities indexes (such as the S&P 500 or MSCI EAFE) or ETFs.
In addition, to seek to offset some of the risk of a potential decline in value of certain long positions, the Fund may also purchase put options on individual securities, broad-based securities indexes (such as the S&P 500), or ETFs. The Fund may also engage in active and frequent trading of portfolio securities. The Fund’s investment adviser seeks to lower the risks of investing in stocks by using a “top-down approach” of diversification by company, industry, sector, country and currency and focusing on macro-level investment themes
Maximum Sales Charge – 4.75% Expense Ratio 1.22%