Comparing Alpha DNA vs Traditional 60-40 vs Hedged Equity Category
November 10, 2021
By Joshua Chartier and Wayne Ferbert
At last week’s FA Magazine webinar, an attendee posed the following question: how does the hedged equity space compare to a traditional 60/40 portfolio during market corrections?
This is a great question because the hedged equity space claims to be a strong replacement option to the traditional 60/40 portfolio. The answer: Very similarly! The analysis is presented below as Analysis #1. As an advisor, if you are considering hedged equity to replace 60/40 allocations in a rising interest rate environment, you can believe that hedged equity strategies will perform as well as 60/40 portfolios during a market correction.
The obvious follow-up question is: how does the hedged equity space compare to a traditional 60/40 portfolio during the full market cycle? Unfortunately, this answer is more complicated. You can see the analysis below in Analysis #2. At Alpha DNA, our hedged equity strategies materially out-perform the traditional 60/40 portfolio. But the hedged equity space is not as fortunate. In our analysis below, the average return of the five largest Hedged Equity Mutual Funds is materially lower than the traditional 60/40 portfolio.
Time and time again, these kinds of analyses prove that manager selection matters … and Alpha DNA will matter in your manager selection.
The constituents in our analysis
For the Traditional 60/40 portfolio, we used the Vanguard Balanced Index Fund – ticker VBIAX. It invests 60% in an index of US Stocks (CRSP US Total Market Index) and 40% in a popular bond index (Bloomberg Barclays US Aggregate Float Adjusted Index). The fund has a very small fee so it represents a great proxy for an index approach to the 60/40 portfolio.
The Hedged Equity benchmark we use is the daily average return of the 5 largest Hedged Equity Mutual Funds, tickers: JHQAX, GATEX, SDRAX, GTSOX, and CAHEX. These 5 funds make up more than 90% of all of the AUM in the open ended mutual fund category for Hedged Equity mutual funds.
For the S&P 500, we use the popular exchange traded fund, SPY, SPDR S&P 500 ETF Trust.
For Alpha DNA, we use our core two Hedged Equity SMA returns: Alpha DNA Large Cap Hedged Equity SMA and the Alpha DNA Mid-Small Cap Hedged Equity SMA.
The time frame for our analysis is January 1, 2018 to September 30, 2021. We picked this window because it includes two specific material market corrections: Q4 2018 and Q1 2020. It also includes the build up to the corrections, the corrections themselves, and the market recovery from the corrections.
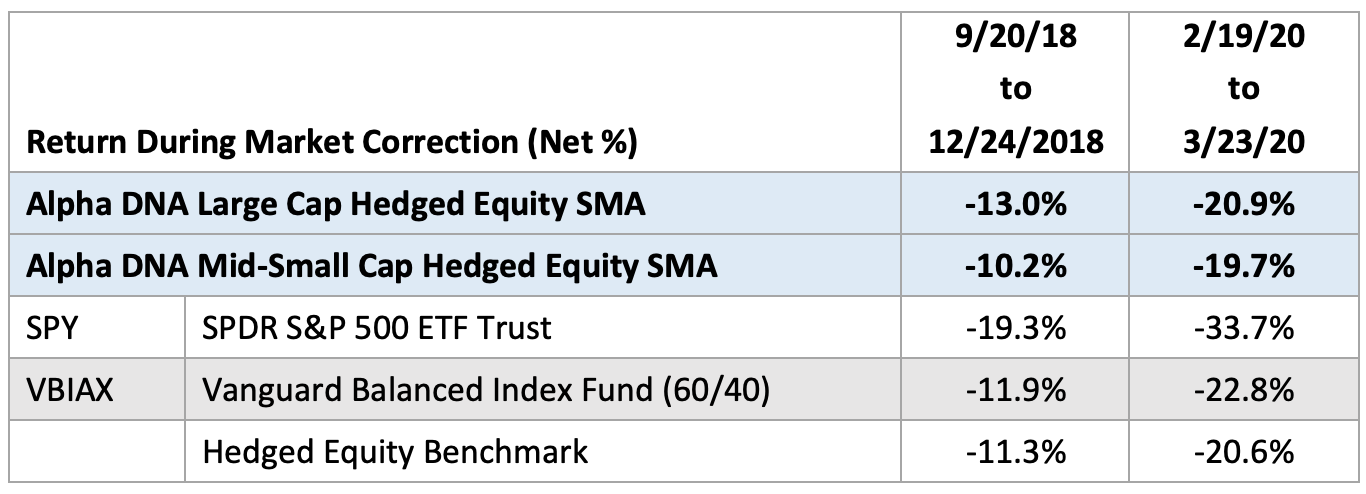
Analysis #1: Drawdown comparisons
Our two drawdown periods for comparison are taken from the peak close in the SPY to the bottom close in the SPY on a daily basis. These two periods are 9/20/18 to 12/24/18 and 2/19/20 to 3/23/20. As you can see in the chart below, these drawdown results for these investments in our analysis are all very comparable. At least for the last 3+ years, one would have to conclude that Hedged Equity and 60/40 portfolios produced similar drawdown results.
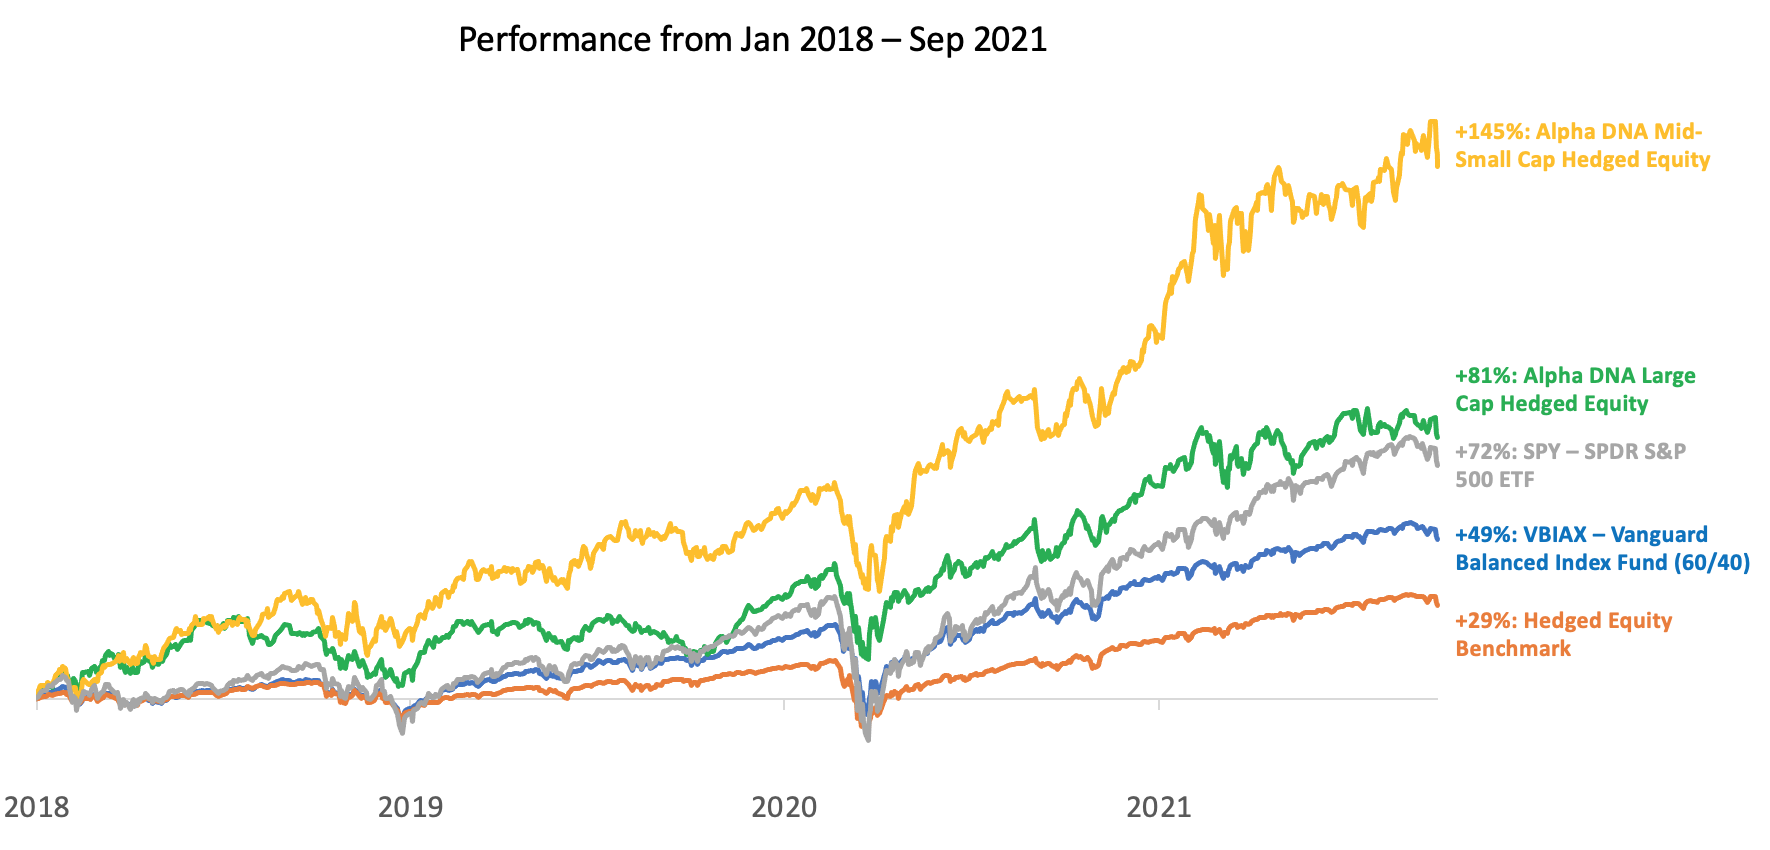
Analysis #2: Full cycle comparisons
You can clearly see from the chart below that the Hedged Equity benchmark is the real laggard. This is disappointing for the space overall. Our analysis above showed that the space did quite well compared to the 60/40 space during drawdowns. This clearly means that during the Recovery period and/or the Benign market periods, these top 5 Hedged Equity Mutual Funds must really drag down returns on average.
At Alpha DNA, we don’t have that problem. From the beginning of 2018 to the end of Sept 2021, which includes both periods mentioned above, the S&P 500 has returned 15.5% annualized. VBIAX has returned a respectable 11.2% annualized which is a decent compromise given its downside risk profile. Yet, while Alpha DNA’s drawdown risk profile is similar to VBIAX, our Large Cap Hedged Equity and Mid/Small Cap Hedged Equity SMA portfolios have returned 17.1% and 27.0% annualized, respectively.
Both of our portfolios have outperformed the S&P 500 while demonstrating risks that much more in line to that of the more conservative VBIAX. Perhaps you can have your cake and eat it too!
Now, there is no guaranteed the past results will carry forward to the future, but we believe we have created something special. By combining our alpha generating machine learning techniques with our disciplined options strategy, we believe we have formula that can grow and protect your wealth for a long time to come.
Disclosure:
Source: Morningstar
Performance data quoted represents past performance and is no guarantee of future results. Current performance may be lower or higher than the performance data quoted. Investment return and principal value will fluctuate so that an investor’s shares, when redeemed, may be worth more or less than original cost. Returns less than one year are not annualized. For the most recent standardized performance for the funds, click on the following respective ticker: JHQAX; GATEX; SDRAX; GTSOX; CAHEX.
Alpha DNA Investment Management LLC d/b/a Alpha DNA Investment Management, is a registered investment adviser. The firm only transacts business in states where it is properly registered, or is excluded or exempted from registration requirements. Registration as an investment adviser does not constitute an endorsement of the firm by securities regulators nor does it indicate that the adviser has attained a particular level of skill or ability.
Information presented is believed to be factual and up-to-date, but we do not guarantee its accuracy and it should not be regarded as a complete analysis of the subjects discussed. All expressions of opinion reflect the judgment of the author on the date of publication and are subject to change. Content should not be viewed as personalized investment advice and should not be construed as an offer to buy or sell, or a solicitation of any offer to buy or sell the securities discussed.
All investment strategies have the potential for profit or loss. Different types of investments involve varying degrees of risk, and there can be no assurance that any specific investment or strategy will be suitable or profitable for a client’s portfolio
Historical performance results for investment indexes and/or categories generally do not reflect the deduction of transaction and/or custodial charges or the deduction of an investment-management fee, the incurrence of which would have the effect of decreasing historical performance results. There are no assurances that a client’s portfolio will match or outperform any particular benchmark. Asset allocation and diversification will not necessarily improve an investor’s returns and cannot eliminate the risk of investment losses.
PAST PEFORMANCE IS NOT NECESSARILY INDICATIVE OF FUTURE RESULTS.
The information and opinions expressed herein are as of the date appearing in this material only, are not complete, are subject to change without prior notice, and do not contain material information regarding the Fund or portfolio, including specific information relating to an investment in the Fund or portfolio and related important risk disclosures. The descriptions herein of the strategy’s investment objectives or criteria, the characteristics of its investments, investment process, or investment strategies and styles may not be fully indicative of any present or future investments, are not intended to reflect performance and may be changed in the discretion of Alpha DNA. While the data contained herein has been prepared from information that Alpha DNA believes to be reliable, Alpha DNA does not warrant as to the accuracy or completeness of such information.