December 2021 and Mid-January Update
January 18, 2022
January 18, 2022 - Commentary
The current market rotation that favors value over growth has accelerated in recent weeks and placed all of our strategies under some pressure both in terms of absolute performance and performance relative to our hedging indices. To understand where the strategy has come from and where it is going, it is important to understand this rotation. Let’s dive in.
For the mid- and small cap space, this value-favoring rotation started in first quarter 2021 in February. Value stocks in mid- and small-cap have steadily built their out-performance over growth over that time period. Thru last Friday’s close (Jan 14th), from February 10th of 2021, the Russell 2000 Growth index is down -19% while the Russell 2000 Value index is up nearly +10%. The 29% spread between those two factors in the small cap space is historically wide. We expect buyers to start stepping into the growth space in small cap soon, but nothing is assured. It is also helpful to note that the Russell 2000 itself is down around 6% over this same window.
In the mid-cap space, the performance difference between Value and Growth is also reaching historically wide spreads. From Feb 10, 2021 to January 14, 2022, the S&P 400 Mid Cap Growth index is up +4% while the S&P 400 Mid Cap Value index is up +23%. This difference is nearing historic proportions.
In the large cap space, the rotation to value started in December of 2021, so it is late to the party. The rotational spread of value over growth in the large cap space is still less than 10%– but the capital involved in the rotation is significantly greater than that of their mid- and small-cap counterparts. With an increase in capital being impacted, we believe it will bring more scrutiny to the rotation.
Our strategy is engineered to find the companies that are most likely to out-perform the Wall Street analyst consensus for EPS and Revenue. This leads us to companies with hidden growth that is just now being revealed to the market thru the changes in the company’s digital footprints. This leans our portfolio into companies capable of significant growth – which results in a bias towards the growth factor. As a result, our equity portfolios are under-performing the broad indices that are spread more evenly between growth and value stocks.
We are proud of the overall returns we were able to post in 2021 given the value rotation was against us in mid- and small-cap for the majority of the year and it was significant. After all, we lean into growth but still managed to post index beating returns in the mid- and small-cap space for 2021. However, the recent performance in January 2022 is creating a hole we will have to dig out of. We are still confident that a portfolio that can find EPS and Revenue surprise will be rewarded – but we may need the influence of macro trading pressures to subside and for the market to trade more for micro-reasons before we are rewarded with outperformance once again.
Why are we confident?
Our confidence stems from three things we know about the markets and our strategy. The first is that our metrics related to analyst upgrades for our current portfolios over the last 3 weeks (since our last rebalance) looks just like it has for the majority of outperforming portfolios we have built for the last 3+ years. In other words, the portfolios continue to find beats and analyst upgrades at the same rates they have historically – despite the sell off the last 3 weeks.
Second, the portfolio is 60% exposed to mid- and small-cap stocks and the rotation to value in those market caps has persisted for quite some time and has already reached historically wide levels. This is usually where buyers step in to purchase those kinds of stocks – especially if we are correct and those companies achieve strong earnings potential. Of course, the market is always capable of extended rotations and sell offs, but we believe we are well positioned if the tide turns.
Third, we have realized that the companies that grow their earnings and revenues the fastest are typically the stocks that are rewarded the most over the longer time horizons. In fact, over the last 20 years in the markets, the majority of returns have been driven by stocks that did indeed grow their EPS the fastest. According to a study done by O’Shaughnessy Asset Management that looked at over 25+ years of data, even in the value category, the stocks that produce the most EPS growth over any given year produce over 100% of the excess return in the Value category.. Put differently, even when value is in favor, ultimately, the performance of value stocks bends to the actual earnings and revenue realization of a company.
Our Hedges
We have no certainty about where the markets are heading or whether this rotation to value will get worse. However, we do have hedges in place in all of our hedged equity strategies. The Russell 2000 hedges are now getting very close to at-the-money. As of January 18th, our Russell 2000 hedges are less than 2% out-of-the-money. This is our largest and most predominant hedge. It is positioned to provide significant offsetting appreciation to the portfolio if the Russell 2000 continues its aggressive move downwards. Our equity portfolio performance will still matter on a relative basis – but the index hedges on the Russell 2000 are very close to the money which will be helpful if this sell off continues or picks up strength.
2021 Year to date comparison to Hedged Equity Leaders
We are happy with our relative performance of our strategies in what has been a market that did not favor our type of equity bias. We continue to outpace the majority of our peers on a 1 year basis in the Hedged Equity category for each of our three Hedged Equity strategies: the All Cap, the Large Cap, and the Mid-Small Cap strategies. In fact, we out-pace most of these funds on a 2-, 3-, and 4-year basis also. Reach out to us and we’ll share with you the analysis. These hedged equity mutual funds are the largest Hedged Equity mutual funds by Assets under management according to Morningstar.
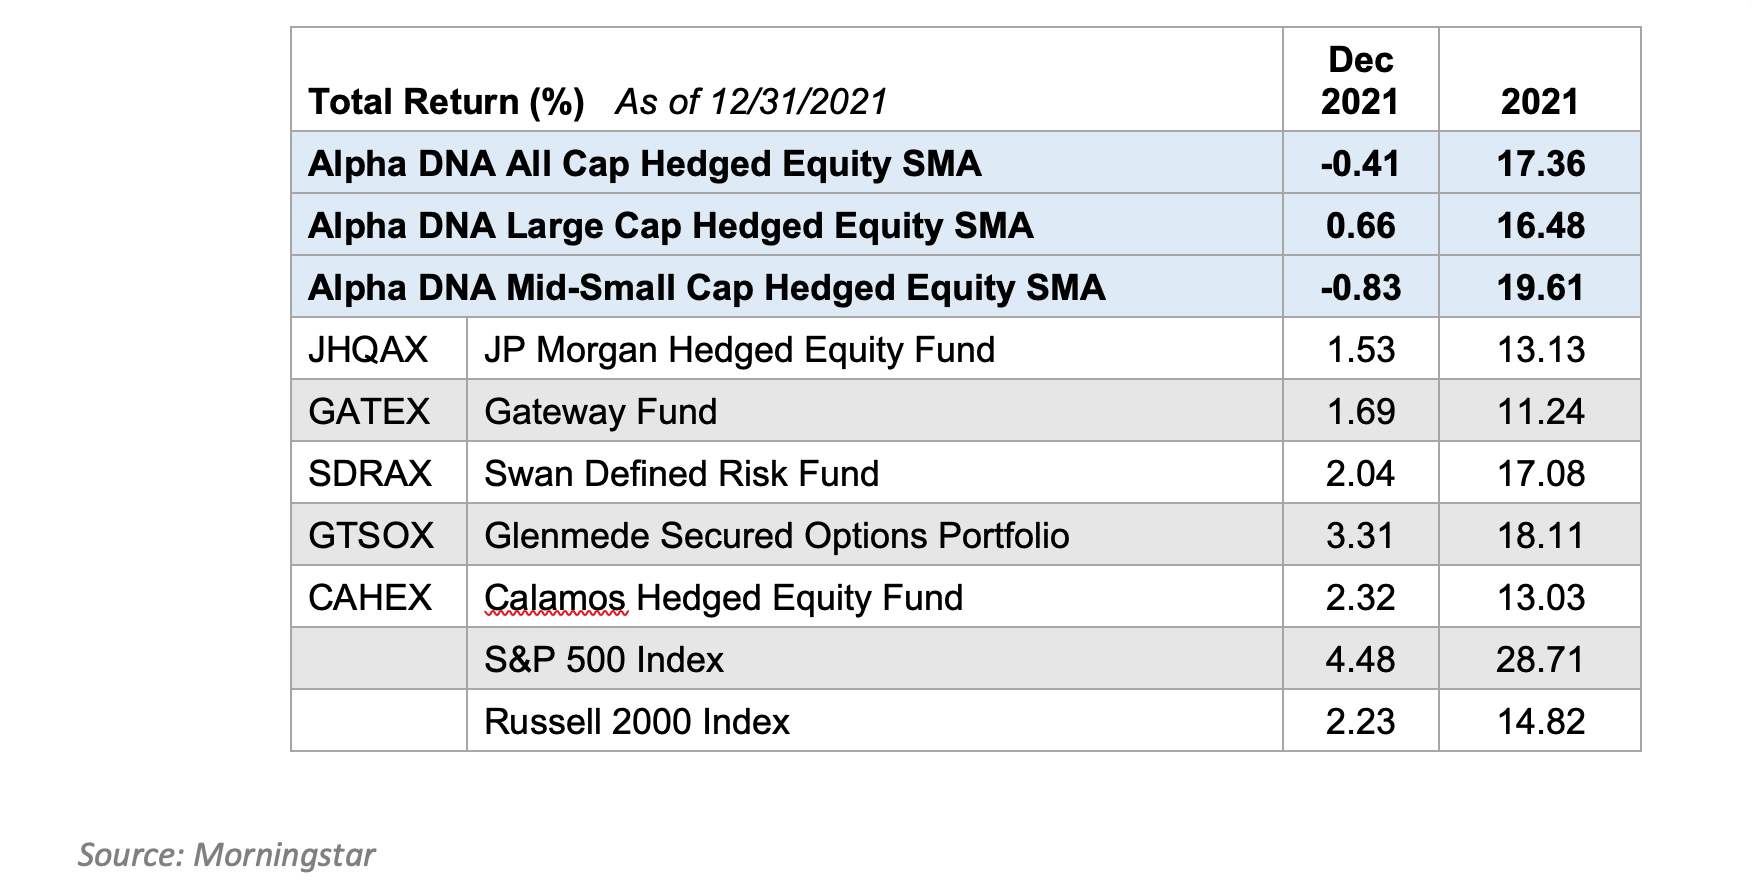
Performance data quoted represents past performance and is no guarantee of future results. Current performance may be lower or higher than the performance data quoted. Investment return and principal value will fluctuate so that an investor’s shares, when redeemed, may be worth more or less than original cost. Returns less than one year are not annualized. For the most recent standardized performance for the funds, click on the following respective ticker: JHQAX; GATEX; SDRAX; GTSOX; CAHEX.
These funds were chosen for comparison because they are some of the largest publicly traded funds employing a hedged equity strategy and have at least a five-year track record. We figured, let's compare ourselves to the BIGGEST players in the industry.
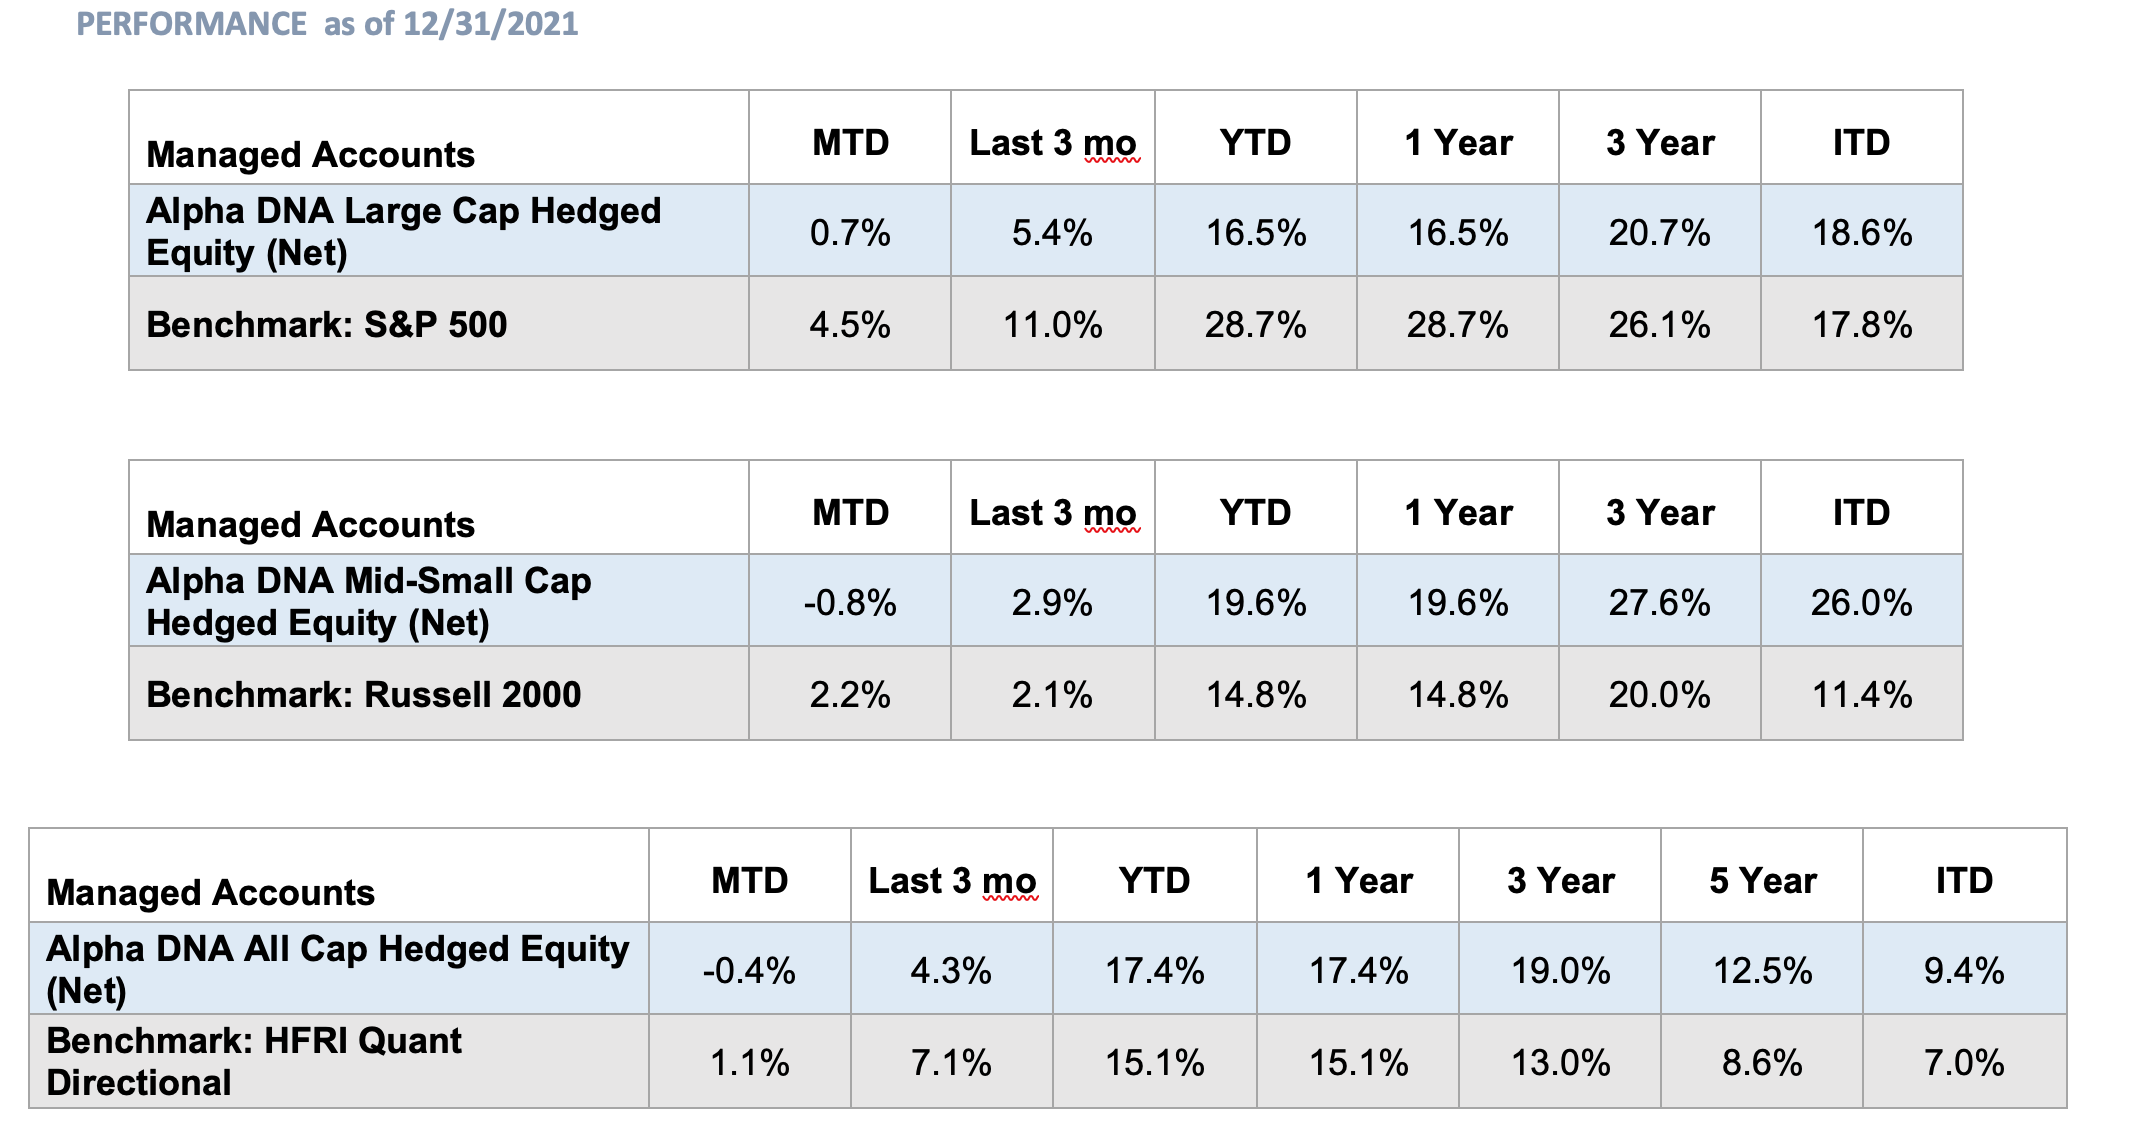
For all returns covering more than 12 months, the returns are annualized. For the Alpha DNA Large Cap Hedged Equity, the inception date is 3/1/2017. For the Alpha DNA Mid-Small Cap Hedged Equity, the inception date is 1/1/2018.
You can find a summary of our returns below. Please reach out to talk to us about these exciting cutting-edge strategies at (443)-288-6444. Or email us at wayne.ferbert@alphadnaim.com
Disclosures:
Note: Returns are expressed in US Dollars net of fees.
Alpha DNA Investment Management is a registered investment adviser and investment manager that specializes in quant equity strategies. Alpha DNA is a separate accounts manager and all returns expressed herein are solely from the separate accounts business within Alpha DNA.
ALPHA DNA ALL CAP HEDGED EQUITY Composite includes all institutional and retail portfolios that invest in a diversified portfolio of over 50 total U.S. equity positions – either long and/or short. The strategy aims to reduce systematic market risk by identifying the stocks most likely to out-perform other stocks based on changing demand. Risk is further mitigated by implementation in market neutral posture when the research indicates potential for a downward market. The portfolio is designed to find picks that will out-perform the counter-parts. The Internet Advantage Strategies is a series of strategies based on an innovative new research approach; ALPHA tracks the digital Internet footprint of publicly traded companies to find hidden demand trends in the market place. This composite includes all portfolios that were at least 70% dedicated to this strategy. The benchmark is the HFRI Quantitative Directional Equity Hedge Fund Index. The HFRI Quantitative Directional Equity Hedge Fund Index is a subset of the HFRI Equity Hedge Fund Index that measures the aggregate performance of equity hedge funds that employ quantitative strategies that can use long and short equity positions and the portfolio can be positioned net long or net short. HFRI benchmark will always include an estimate from HFRI for the most recent month. The returns are typically finalized by HFRI within one month after the end of the reported month – but can sometimes be revised up to 90 days later by HFRI.
Alpha DNA claims compliance with the Global Investment Performance Standards (GIPS). GIPS® is a registered trademark of CFA Institute. CFA Institute does not endorse or promote this organization, nor does it warrant the accuracy or quality of the content contained herein. To receive a full list of composite descriptions of Alpha DNA and/or a presentation that complies with the GIPS standards, contact Wayne Ferbert at (443)-288-6444 or wayne.ferbert@alphadnaim.com
All investments involve the risk of potential investment losses as well as the potential for investment gains. Prior performance is no guarantee of future results and there can be no assurance, and clients should not assume, that future performance of any of the model portfolios will be comparable to past performance.
These results should not be viewed as indicative of the advisor’s skill. The prior performance figures indicated herein represent portfolio performance for only a short time period, and may not be indicative of the returns or volatility each portfolio will generate over a long time period. The performance presented should also be viewed in the context of the broad market and general economic conditions prevailing during the periods covered by the performance information. The actual results for the comparable periods would also have varied from the presented results based upon the timing of contributions and withdrawals from individual client accounts. The performance figures contained herein should be viewed in the context of the various risk/return profiles and asset allocation methodologies utilized by the asset allocation strategists in developing their model portfolios, and should be accompanied or preceded by the model.
Standard deviation is a measure of the dispersion of a set of data from its mean. The more spread apart the data, the higher the deviation. In finance, standard deviation is applied to the annual rate of return of an investment to measure the investment's volatility.